Facial expression-based technologies have flooded our daily lives. However, most technologies are limited to Ekman's basic facial expressions and rarely deal with more than ten emotional states.
This is not only due to the lack of prototypes for complex emotions but also the time-consuming and laborious task of building an extensive labeled database.
To remove these obstacles, we were inspired by a psychophysical approach for affective computing, so-called the reverse correlation process (RevCor), to extract mental prototypes of what a given emotion should look like for an observer.
We proposed a novel, efficient, and interdisciplinary approach called Interactive Microbial Genetic Algorithm (IMGA) by integrating the concepts of RevCor into an interactive genetic algorithm (IGA).
Our approach achieves four challenges: online feedback loop, expertise-free, velocity, and diverse results.
Experimental results show that for each observer, with limited trials, our approach can provide diverse mental prototypes for both basic emotions and emotions that are not available in existing deep-learning databases.
Method & Experiment
If your browser does not support the video tag,
click here.Supplementary materials
According to the structural order of our manuscript, we present the supplementary figures and demonstrations for better understanding:
Example of population initialization. We use GANimation to generate different facial expressions (from #1 to #20) from a neutral face (#0 in pink) and different AU (action unit) vectors.
Differing from the majority of facial manipulation techniques that are designed to modify high-level attributes such as hair color, gender, age, or emotional expressions,
GANimation is trained by the low-level attributes, which are action units (AUs).
As the AU vectors were randomly initialized, some facial expressions do not correspond to any emotional state, such as #2 with the activation of AU4 (brow lowerer), AU5 (upper lid raiser), and AU12 (lip corner puller).
GA parameter settings
It is necessary to find a set of relatively appropriate GA parameters before observers perform the perceptual experiments.
These parameters are the crossover rate \(cr\), the mutation rate \(mr\), the population size \(N\), the thresholds of the constraint automaton \([T1, T2, T3]\) and constants for the population evaluation \(\alpha,\beta\).
Some parameters were set according to the suggestion from the litterature of MGA: \(cr=0.5,mr=0.03\).
Some parameters were taken empirically.
Considering user fatigue, the system needs to finally converge in a limited time (we set it to 15 minutes).
We need to calibrate the time-sensitive parameters: population size \(N\) and thresholds of the constraint automaton \([T1, T2, T3]\), since the first one is related to the number of trials for each iteration and the second one is related to the degree of the system convergence.
Empirically, we set \(\alpha=\beta=0.5\) (inter-population similarity and intra-population similarity are both important.) and \(T1=T2=T3-0.05\) (a slightly higher threshold for the stop condition).
We simulated the perceptual experiments by replacing the real observers with an automatic facial expression recognition system.
We took the VGG-19 pretrained model as the simulator which outperformed the facial expression recognition tasks in FER2013 dataset (acc=73.112\%) and in CK+ dataset (acc=94.64\%).
The simulators performed the experiments with different GA parameter settings.
For each experimental task of basic emotions (happiness, sadness, anger), the simulator gave each individual in the last generation a score \(r_i\), which is the output value of the corresponding emotional class in the softmax layer of VGG-19.
We used the average of all individuals to represent the entire population, \(R_k=\frac{1}{N}\sum_{i=1}^{N}r_i\), where \(N\) is the population size and \(k\) is the simulation number.
For each experimental task, the simulator was performed 30 times.
Thus, there were, in total, 90 simulations (30 simulations/task \(\times\) 3 experimental tasks) for a given set of \(N, T1\).
We evaluated the simulations by using the average score to represent all populations for the three experimental tasks, \(R_{f}=\frac{1}{90}\sum_{i=1}^{90}R_k\).
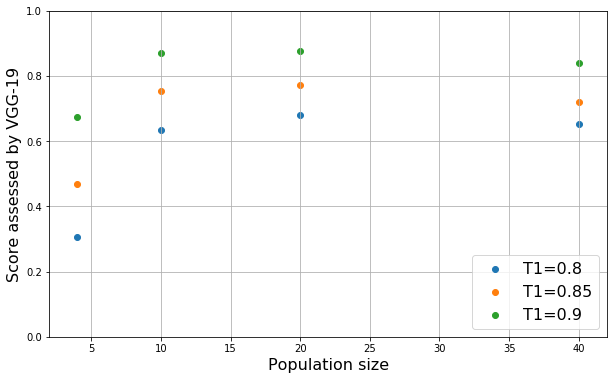
a) The score \(R_f\) assessed by VGG-19
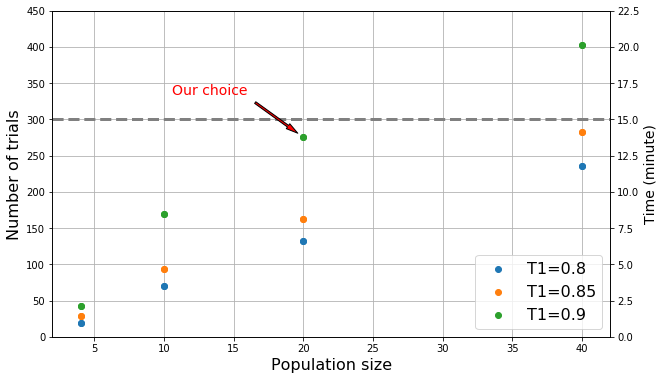
b) Number of trials (left Y-axis) and corresponding times (right Y-axis)
With different combinations of the population size \(N\) and the first threshold \(T1\), we present the final scores (in Fig.a) and the number of trials required for our IMGA (in Fig.b).
In Fig.a, there are two scores that are rather high: \(R_{f}=0.87\) (with \(N=10\) and \(T1=0.9\)) and \(R_{f}=0.88\) (with \(N=20\) and \(T1=0.9\)).
Through the attempts of the authors to perform several perception experiments, the response time for each trial was, on average, less than 3 seconds.
We set, on average, 3 seconds per trial as the estimated time.
Note that the time limit is 15 minutes (dotted line in Fig.b).
We estimated that it took about 8.5 minutes (with \(N=10\), \(T1=0.9\)) and 13.8 minutes (with \(N=20, T1=0.9\)) for one observer to perform one perceptual experiment.
Like most genetic algorithms, there is always a trade-off between time and solution diversity.
Considering the diversity of the mental prototypes, we finally set \(N=20\) and \(T1=0.9, T2=0.9, T3=0.95\).
Indeed, in an initialized population of \(N=20\) individuals, each AU has already been activated an average of 3.75 times.
All representative prototypes
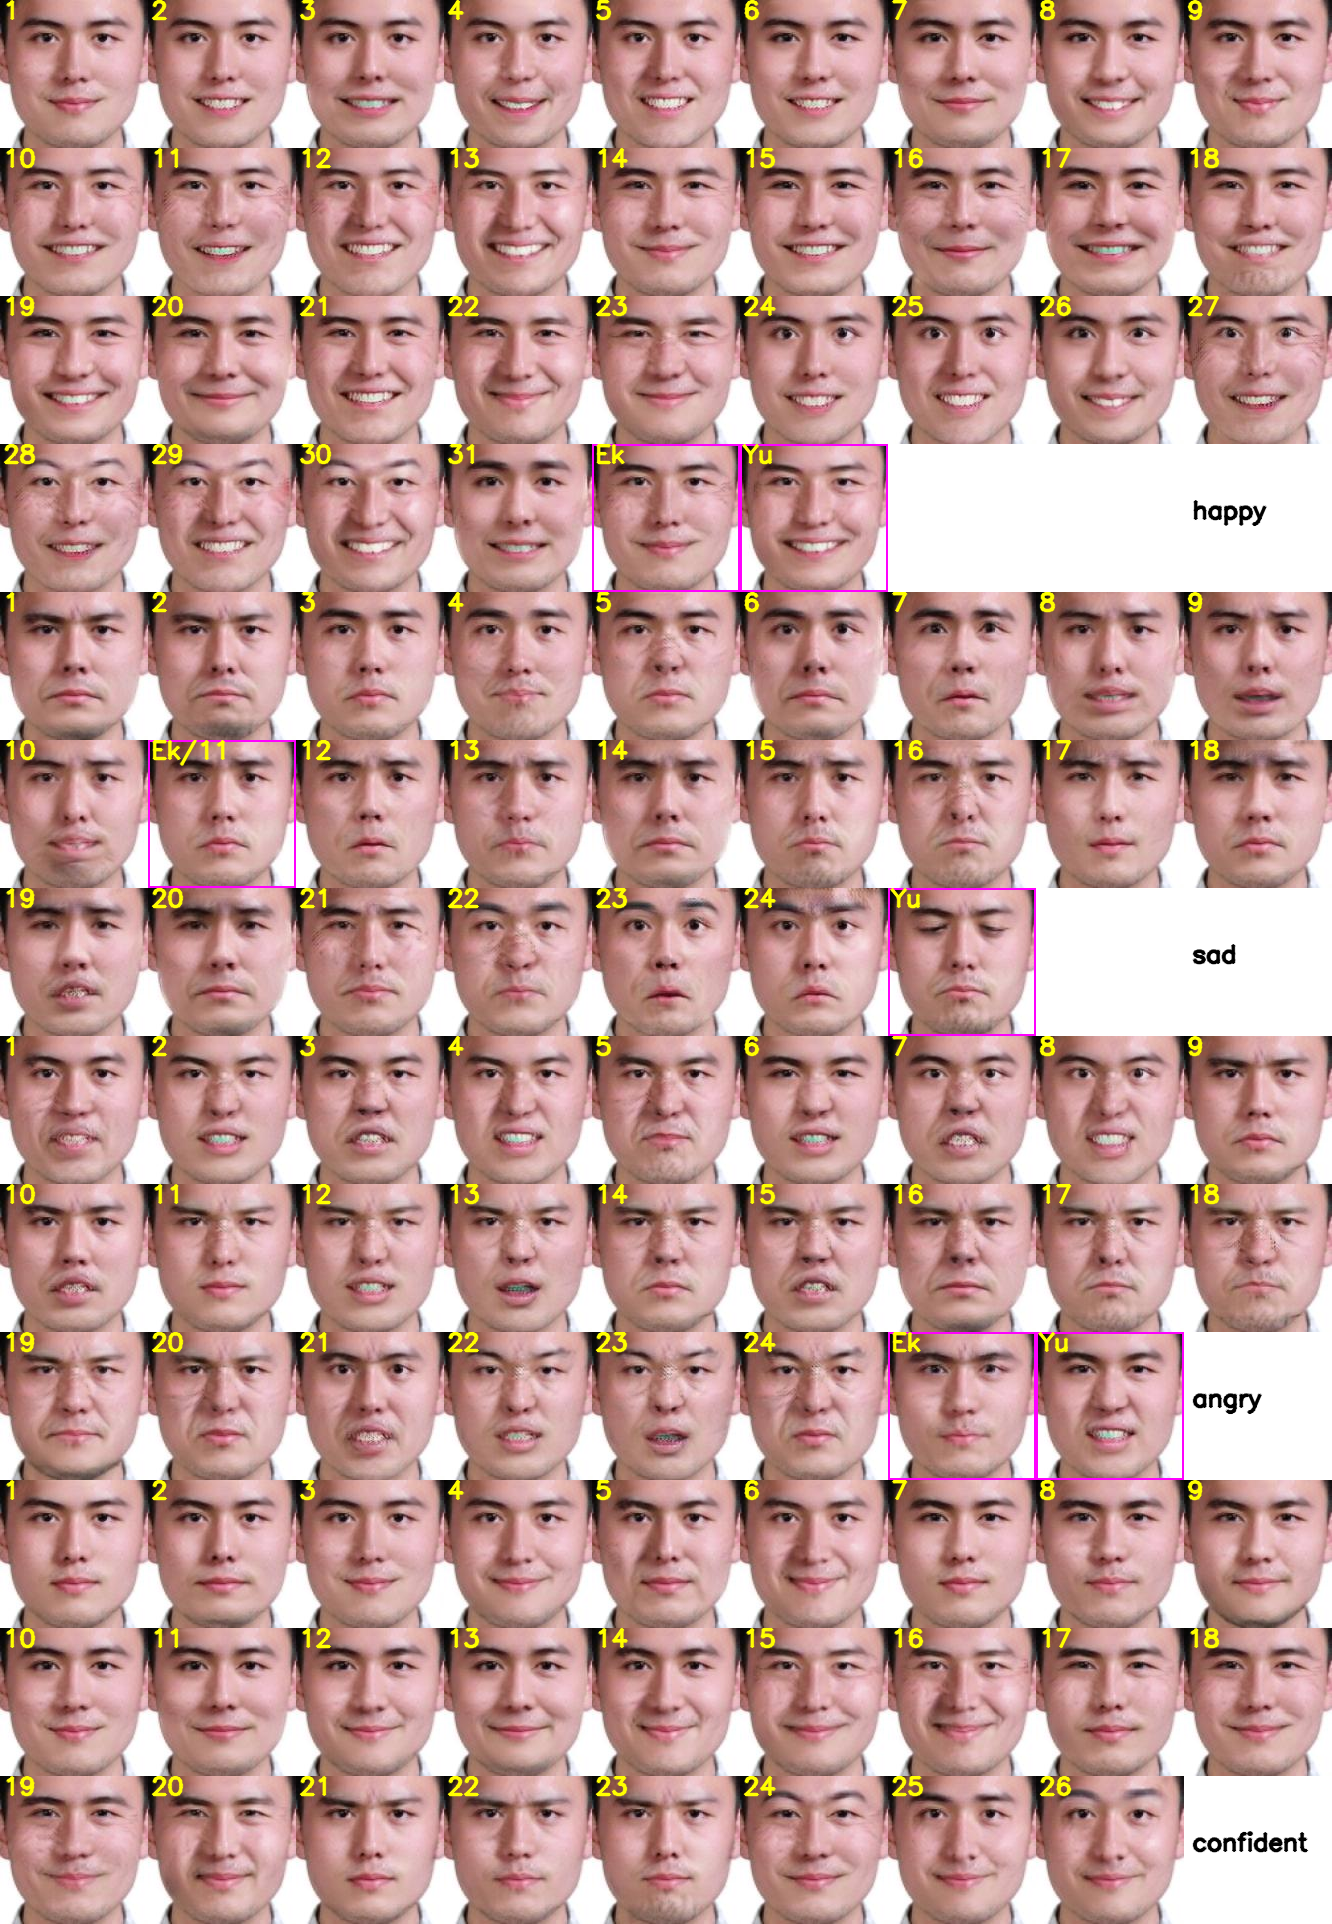
We list all representative prototypes of observers as well as the state-of-the-art prototypes (denoted by "Ek" and "Yu", in pink) for comparison.
Since GANimation does not provide the option to edit AU16 (lower lip depressor), we replace AU16 with AU25 (lips part) to reconstruct the anger prototype of Yu et al.
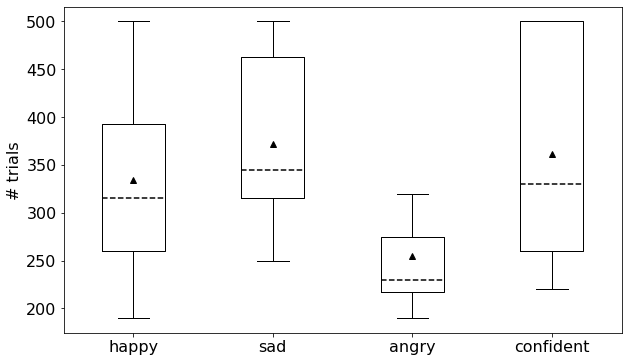
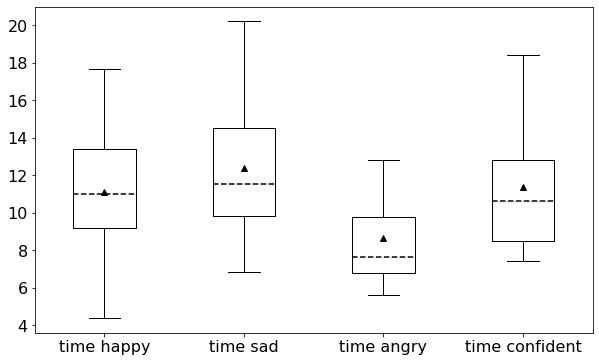
Experiment duration
In Fig.a, box plots (described by the maximum, the minimum, the median, the average, and the first and third quartiles) show the number of trials performed by observers.
The corresponding time for perceptual experiments is shown in Fig.a.
Since the response time for each observer in each trial is different, there are subtle differences between Fig.a and Fig.a.
On average, it took about 10.8 minutes (330 trials) for one observer to perform the perceptual experiment.
Number of trials
Duration (in minutes)
Baseline computation
Here, we present the computation for the baseline of the first measurement:
the proportion of observers who still chose at least one representative prototype of theirs.
The baseline can be regarded as the probability for one observer who still chose at least one of his/her representative prototypes.
For each evaluation task, we define the set of all representative prototypes as \(P\) and the set of the representative prototypes of one observer as \(p_{i}\).
We compute the probability for one observer who did not select his/her representative prototypes:
\(\frac{C_5^{|P|-|p_{i}|}}{C_5^{|P|}}\), where \(C\) is the mathematical combination function and the operator \(|.|\) is the cardinality of a set.
Hence, we can obtain the probability for one observer who still chose at least one of his/her representative prototypes:
\(1-\frac{C_5^{|P|-|p_{i}|}}{C_5^{|P|}}\).
The baseline of one evaluation task is the average probability for the 12 observers:
\(\frac{1}{12}\sum_{i=1}^{12}\left(1-\frac{C_5^{|P|-|p_{i}|}}{C_5^{|P|}}\right)\).
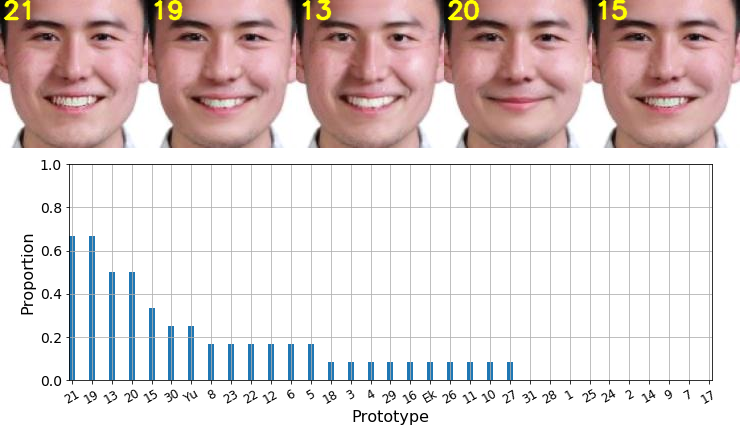
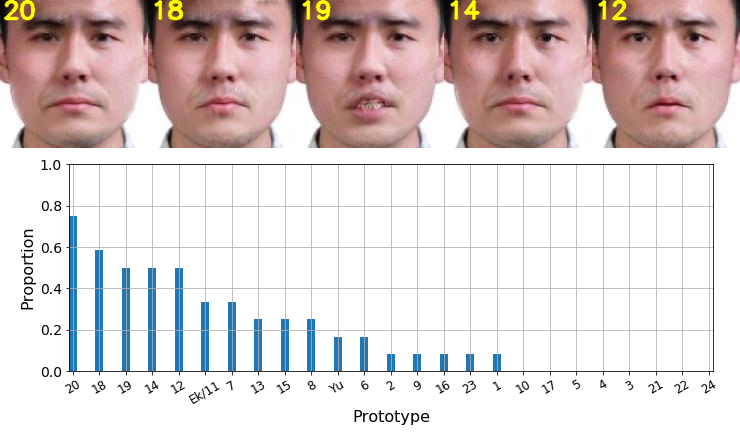
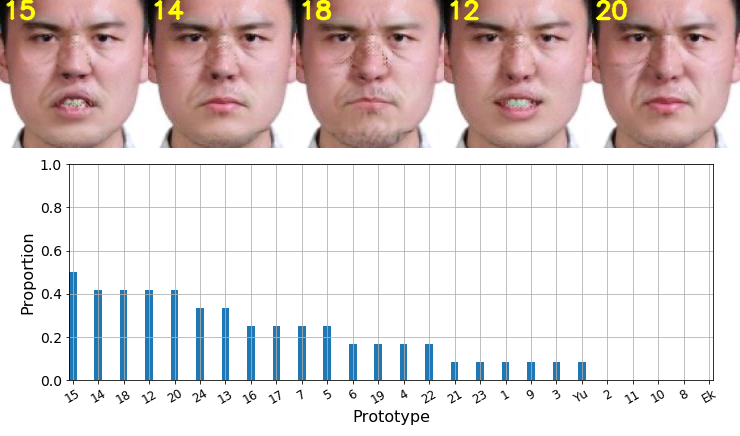
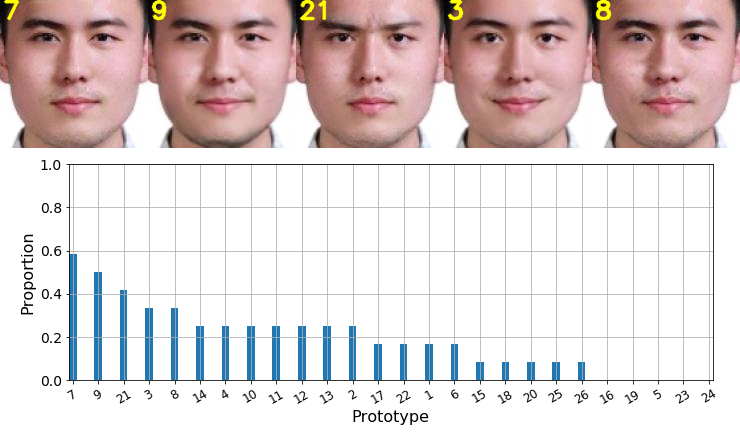
Final ranking of representative prototypes
For the second measurement: we sorted all the prototypes according to the proportion selected by observers and displayed the top 5 prototypes with the highest proportions.
We displayed by images the top-5 prototypes that observers chose the most. The prototype number is marked on the top left of the image. There is no state-of-the-art prototype appearing in the top-5 prototypes.
Since our representative prototype #11-sadness is identical to Ekman-sadness, we merged them and marked them by "Ek/11".
The state-of-the-art prototypes are less preferred by observers.
Happiness
Sadness
Anger
Confidence
Acknowledgement
This work was supported by Randstad France and ANR REFLETS.


 In Fig.a, box plots (described by the maximum, the minimum, the median, the average, and the first and third quartiles) show the number of trials performed by observers.
The corresponding time for perceptual experiments is shown in Fig.a.
Since the response time for each observer in each trial is different, there are subtle differences between Fig.a and Fig.a.
On average, it took about 10.8 minutes (330 trials) for one observer to perform the perceptual experiment.
In Fig.a, box plots (described by the maximum, the minimum, the median, the average, and the first and third quartiles) show the number of trials performed by observers.
The corresponding time for perceptual experiments is shown in Fig.a.
Since the response time for each observer in each trial is different, there are subtle differences between Fig.a and Fig.a.
On average, it took about 10.8 minutes (330 trials) for one observer to perform the perceptual experiment.